

Congratulations
You have successfully set up and run your Virtual Population with 4 variables and requested 500 simulations of size 2000, for each Advanced Option Scenario.
The first step is to decide if there are different scenarios to compare the outcomes between. In this study we are going to create multiple Advanced Option Scenarios to explore the effect that different amounts of missing data will have on the probability of success of the virtual trials.
Create Scenarios
Click on View in the Virtual Population panel
Click on Scenarios tab within the Virtual Population
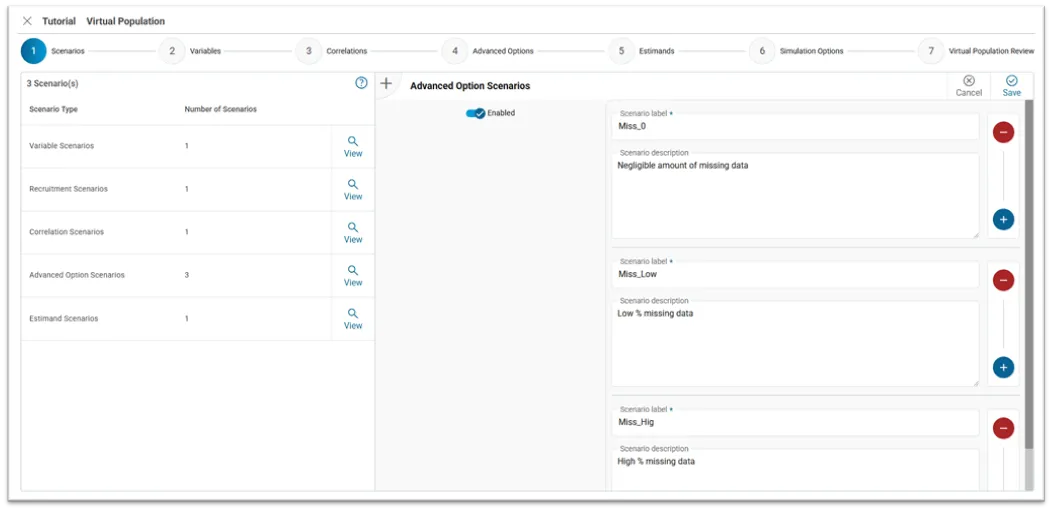
Click ‘View’ next to Advanced Option Scenarios and toggle Activate!
Click on + to create an additional level
In the first level Label enter ‘Miss_0’ and for the Description field enter ‘Negligible amount of missing data’
In the second level Label enter ‘Miss_Low’ and for the Description field enter ‘Low % missing data’
In the third level Label enter ‘Miss_Hig’ and for the Description field enter ‘High % missing data’
Click Save
After activating Advanced Option Scenarios, we will create four variables:
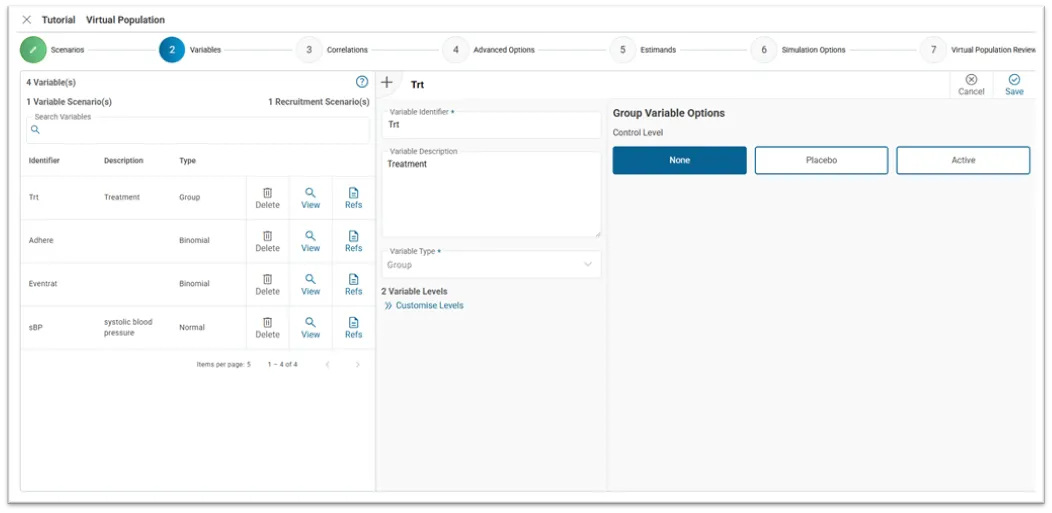
Follow these steps to create the Treatment variable in KerusCloud.
Click on Variables tab within the Virtual Population
In the Variable Identifier field enter ‘Trt’
In the Variable Description field enter ‘Treatment’
Select the Group from the Variable Type drop down
Click Customise Levels: Change the ‘0’ Label to ‘Placebo’ and ‘1’ Label to ‘Active’. No need to enter any Inferred Values.
Click Save in top right
You will see the Trt variable appear on the left of the window, indicating the information has been saved.
This variable will indicate whether a subject has adhered to the treatment regime or not. In KerusCloud this can be created as a bionomial variable.
This binomial variable will be used to define the next variable, the value of which depends on whether the subject has adhered to the treatment.
To add this variable, complete the following steps:
In the Variable Identifier field enter ‘Adhere‘
In the Variable Description field enter ‘Define level of adherence’
Select the Binomial from the Variable Type drop down.
Click Customise Levels: Change the ‘0’ Label to ‘AdhN’ and ‘1’ Label to ‘AdhY’. There is no need to enter any Inferred Values
Click Save & Close
Defined By: Select Population. This implies that the level of adherence is the same across both treatment groups
Variable Parameters: Click on Population, then enter 0.7, for the Single probability under Population. (This will create a virtual dataset where, on average, 70% of the subjects are defined as adhering and consequently 30% as non-adhering)
Click Save in the top right
You will see the Adhere variable appear on the left of the window, indicating the information has been saved.
The event rate for stroke is a layer-based variable in KerusCloud. This implies that the event rate for stroke depends on whether the subject is adhering or not and that the event rate can be different for subjects on placebo compared to those on active treatment.
In the Variable Identifier field enter ‘Eventrat’
In the Variable Description field enter ‘Event rate for stroke’
Select the Binomial from the Variable Type drop down.
Click Customise Levels: Change the ‘0’ Label to ‘StrokeN’ and the ‘1’ Label to ‘StrokeY’. No need to enter any Inferred Values
Click Save & Close
In the Defined By dropdown Select Trt and Adhere
Variable Parameters: each of the following parameters are defined at the ‘Single’ level. For a rationale on the numbers entered here follow this link
Click on Adhere: AdhY & Trt: Placebo: enter 0.144 (14.4 % of all subjects on Placebo are expected to have a stroke during the 4 year course of the study)
Click on Adhere: AdhY & Trt: Active: enter 0.085 (8.5 % of fully adhering subjects on Active treatment are expected to have a stroke)
Click on Adhere: AdhN & Trt: Placebo: enter 0.144 (non-adherence in a placebo group should not affect the risk of stroke)
Click on Adhere: AdhN & Trt: Active: enter 0.103 (30% of subjects non-adhering increases the risk of stroke in this subgroup)
Click Save in the top right
You will see the Eventrat variable appear on the left of the window, indicating the information has been saved.
The systolic blood pressure variable undergoes a normal distribution but will be defined based on the status of the Treatment and Adherence variables, resulting in a bimodal distribution. This implies that the blood pressure reading depends on whether the subject is adhering or not and will also depend on which treatment they have been assigned to.
Variable Identifier: ‘sBP’
Variable Description: ‘systolic blood pressure’
Variable Type: Normal
Defined By: Select Trt and Adhere.
Variable Parameters: each of the following parameters are defined at the ‘Single’ level as no scenarios are set up yet. For a rationale on the numbers entered here follow this link
Click on Adhere: AdhY & Trt: Placebo: under Mean enter 147 and under SD enter 19
Click on Adhere: AdhY & Trt: Active: under Mean enter 134.7 and under SD enter 19
Click on Adhere: AdhN & Trt: Placebo: under Mean enter 147 and under SD enter 19
Click on Adhere: AdhN & Trt: Active: under Mean enter 140.9 and under SD enter 19
Click Save in the top right
You have now created all four variables, displayed on the left as seen in the image below.
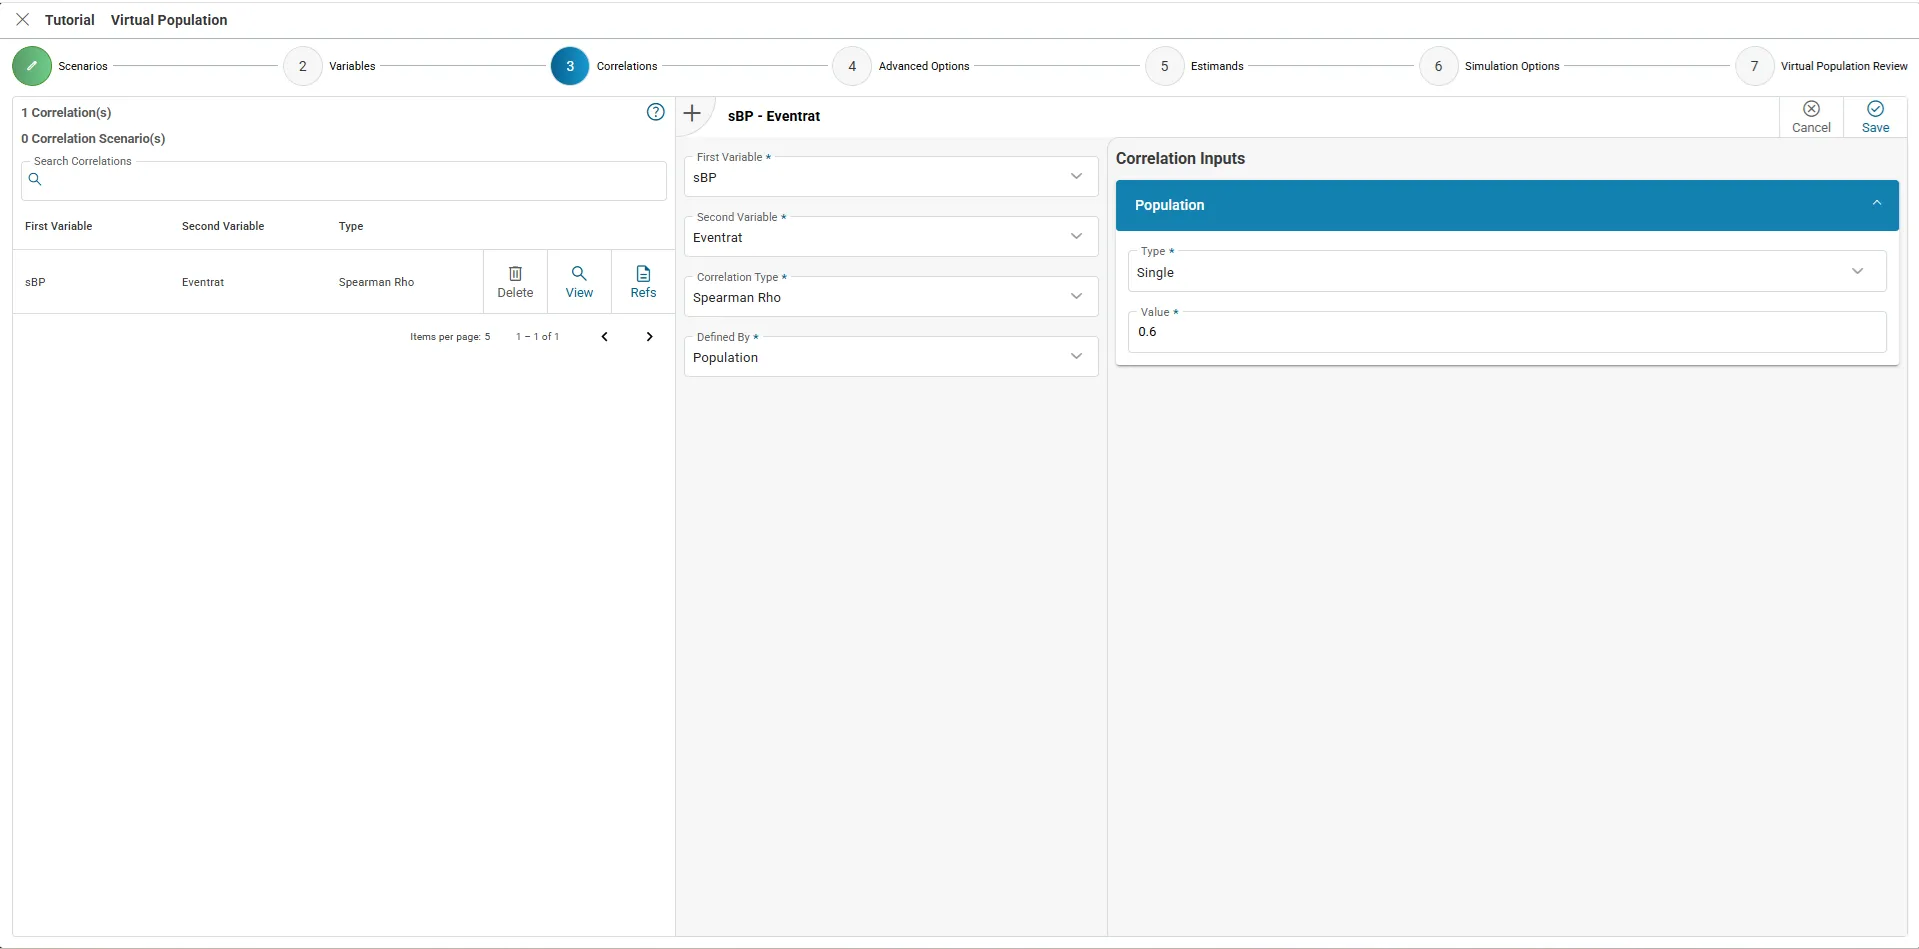
Navigate to the Correlations tab, by either clicking on (3) Correlations at the top, or on Next in the bottom right.
Under First Variable select ‘Eventrat’
Under Second Variable select ‘sBP’
Under Correlation Type select ‘Spearman Rho’
Select ‘Population’ for Defined By
Click on Population, and enter 0.6 for the Correlation Input. (A positive correlation will generate data where subjects who have a stroke have higher average blood pressure than those who don’t have a stroke)
Click Save in the top right corner
You will see the correlation appear on the left of the window, indicating the information has been saved.
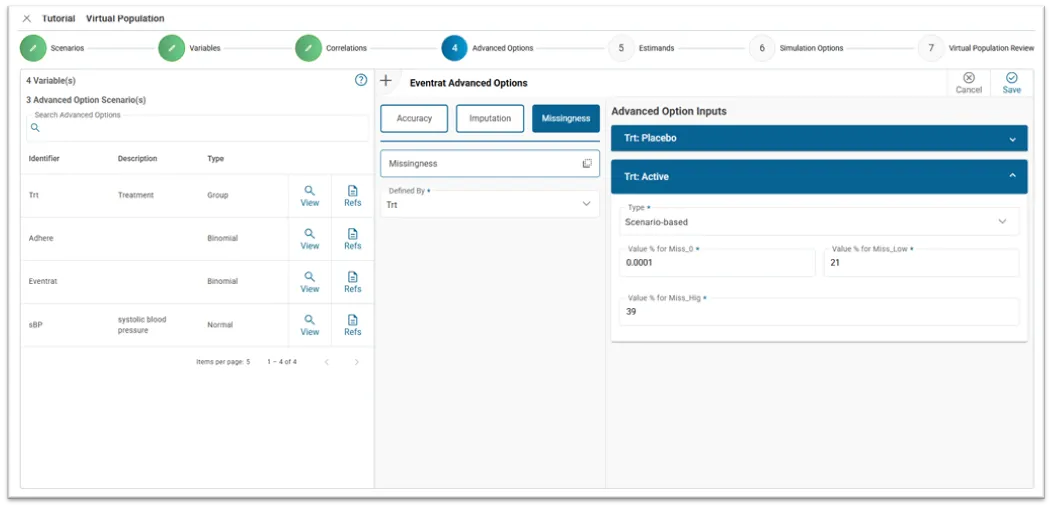
Navigate to the Advanced Options, by either clicking on (4) Advanced Options tab, or on Next in the bottom right.
This step enables you to alter defined variables. In this case, we will randomly add missingness to reflect the expected level of missingness in data collected in the real world.
Click View on the Eventrat variable, click on Missingness and in the Defined By drop down select Trt
Under Placebo enter the following:
Change the Missingness option from Single to Scenario-based
Miss_0: 0.0001
Miss_Low: 29
Miss_Hig: 47
Under Active enter the following
Change the Missingness option from Single to Scenario-based
Miss_0: 0.0001
Miss_Low: 21
Miss_Hig: 39
Click Save on the top right
Click View on the sBP variable: Click on Missingness. Under Defined By select Trt. Change the Missingness option from Single to Scenario-based and enter the same values as above.
Estimands are not used in this tutorial but are one of the advanced features of KerusCloud. They allow a user to control what data to collect under different conditions or assumptions (accounting for intercurrent events such as treatment discontinuation or rescue medication).
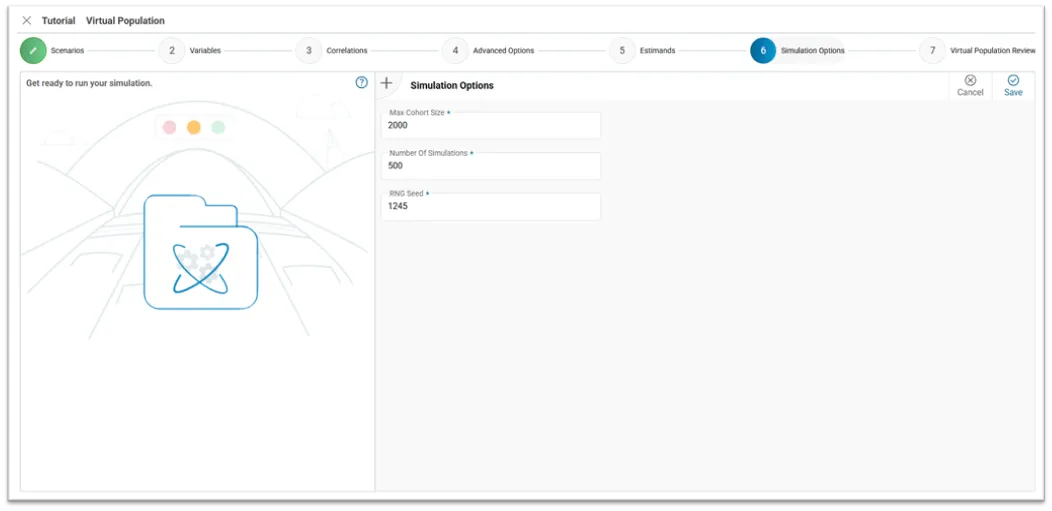
Navigate to the Simulation options, by either clicking on (6) Simulation Options at the top, or on Next in the bottom right.
In the field Max Cohort Size enter ‘2000’
In the field Number Of Simulations enter ‘500’
In the field RNG Seed enter ‘1245’
Click Save in the top right
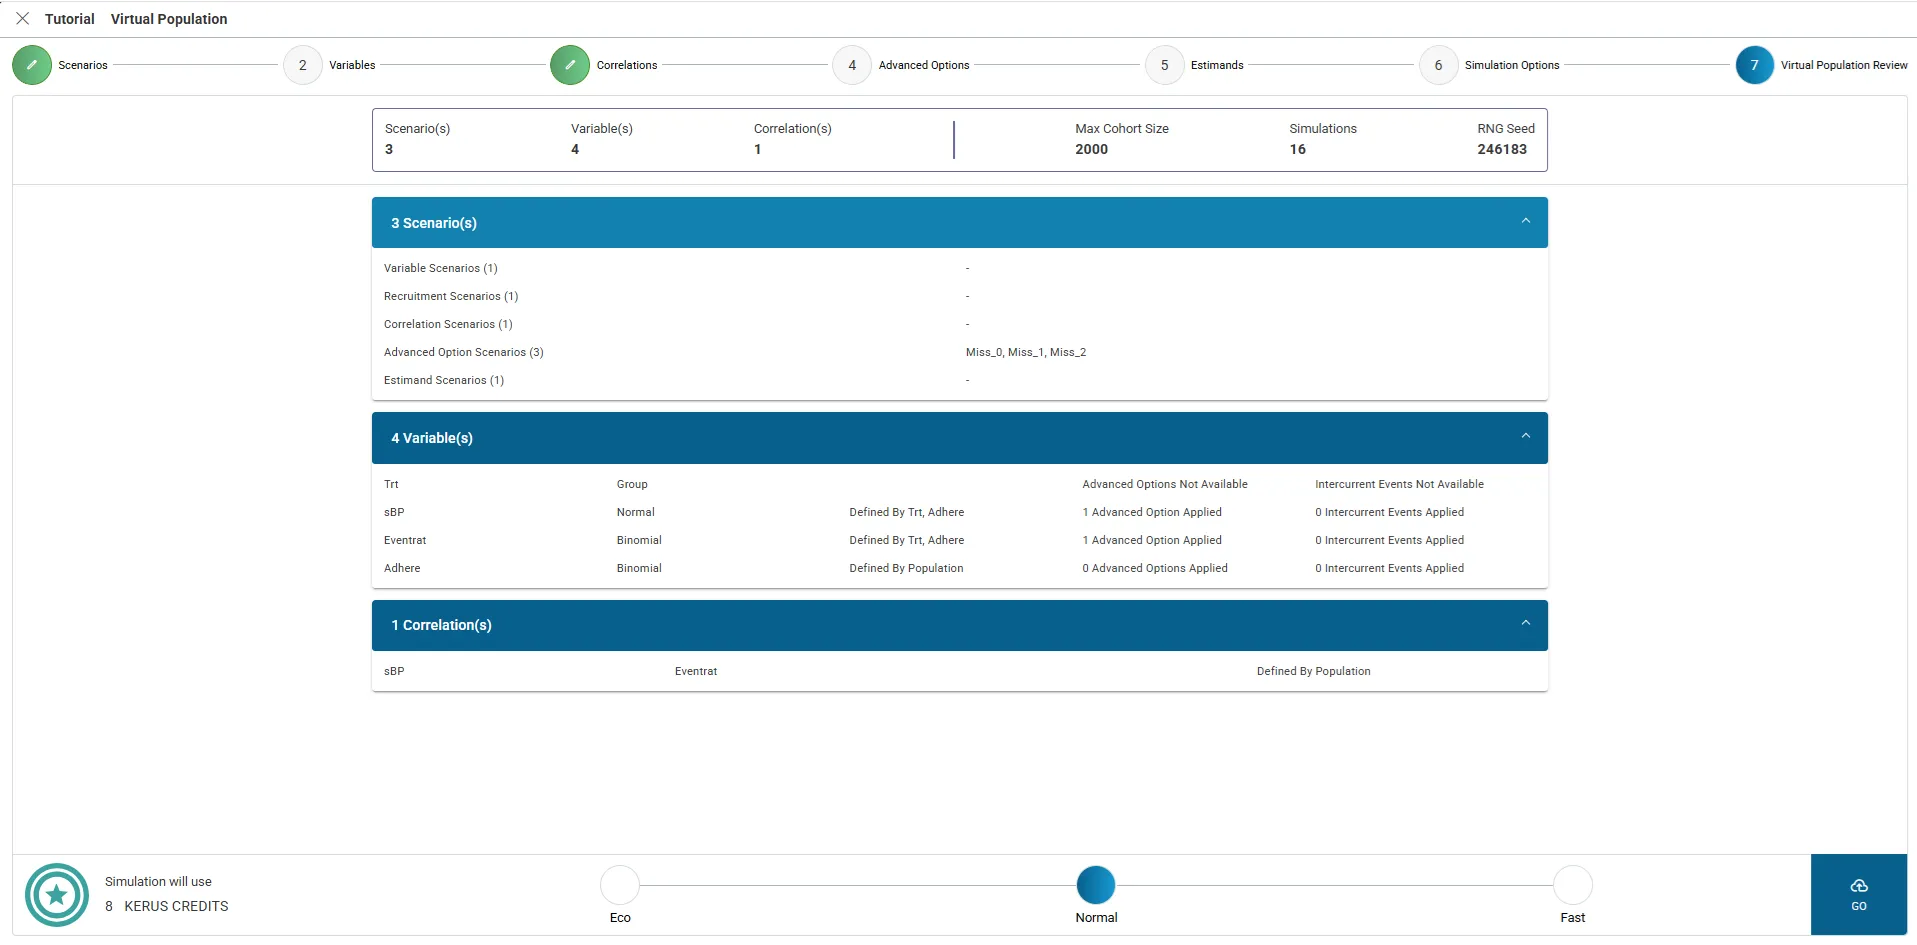
The review page contains a succinct summary of your virtual population, which is useful for sense checking and collaboration. This page also contains the number of Credits it will take to run the project.
Congratulations
You have successfully set up and run your Virtual Population with 4 variables and requested 500 simulations of size 2000, for each Advanced Option Scenario.