

Congratulations
You have successfully set up a KerusCloud project, ran tasks for Virtual Population, Study Design & Analysis, Decision Criteria, created a heatmap and visualised study results.
In this section, a custom heatmap will be created, allowing you to visualise the results of the study.
Click the View button in the Decision Criteria Visualisations section of the project dashboard
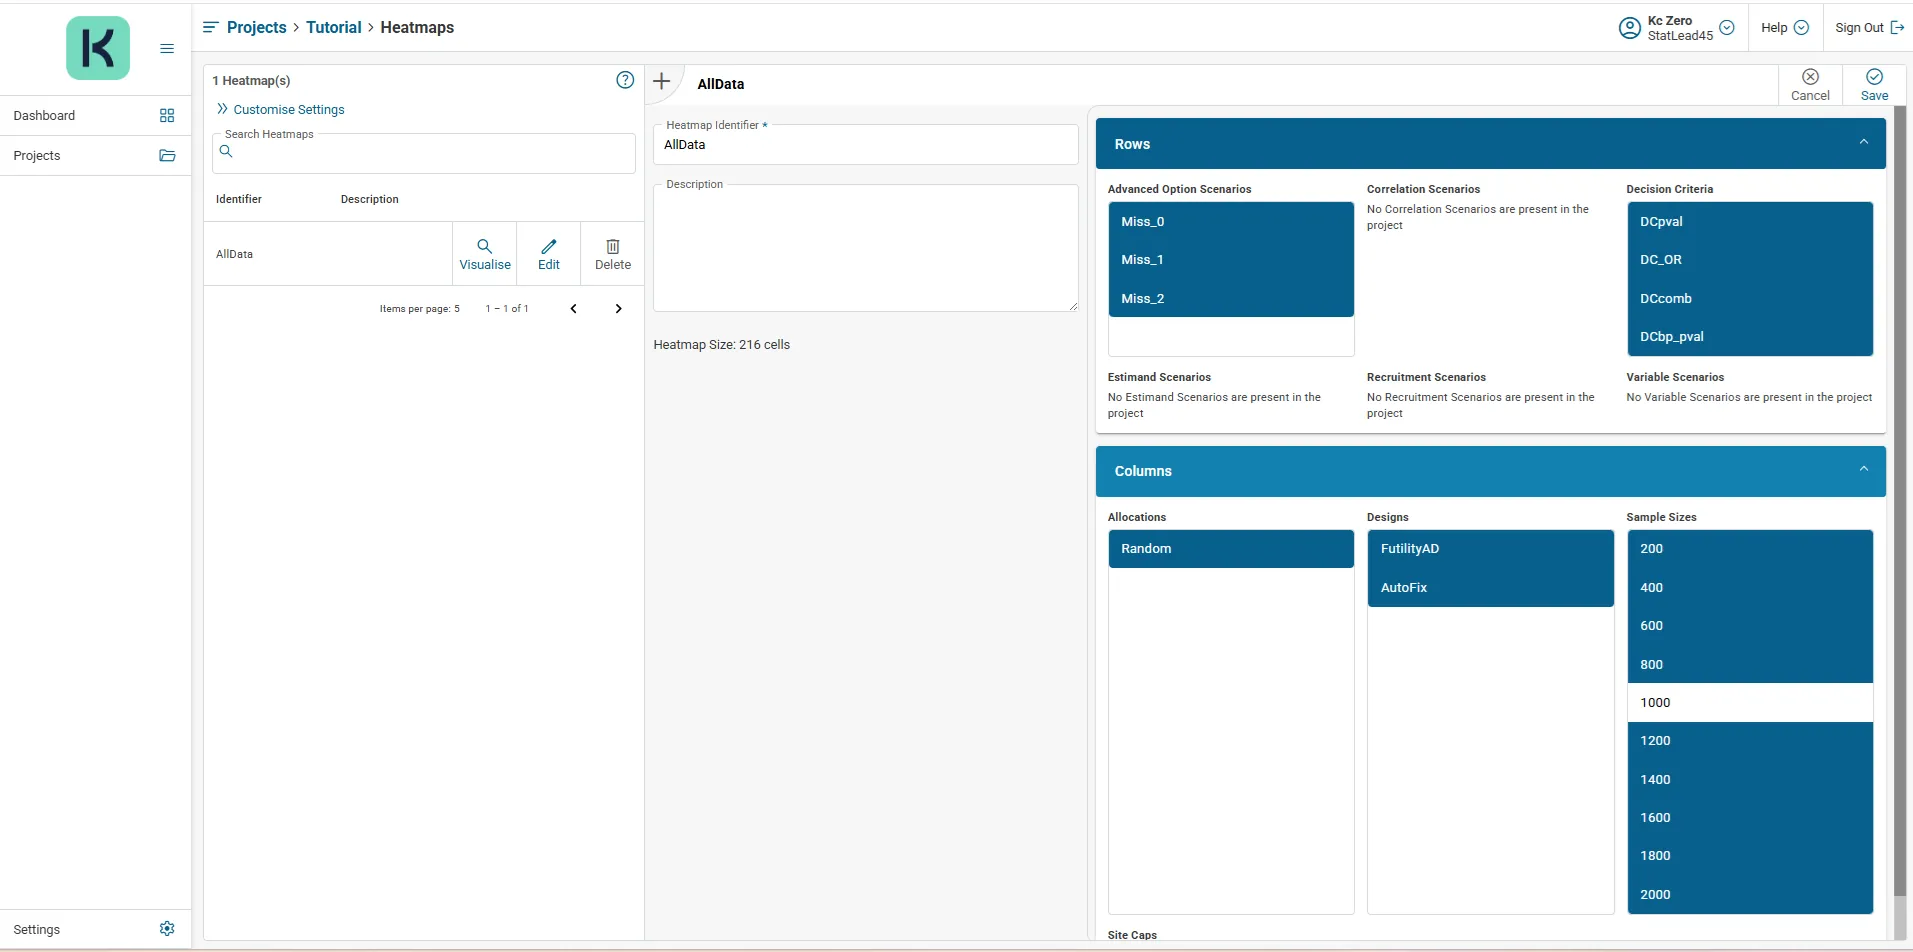
In the New Heatmap section enter a name in the Heatmap Identifier box and optional description in the Description box
Click to expand the Rows accordion, then click to select values* from the rows available that you wish to visualise – at least one value from each of the available rows must be selected.
Click to expand the Columns accordion, then click to select values* from the columns available that you wish to visualise – at least one value from each of the available columns must be selected .
Click Save in top right corner to save the heatmap definition
*As you click to select additional values to rows and columns of the heatmap, the heatmap size will increase. A maximum size of 216 cells is allowed.
After successful creation of a heatmap, the heatmap can be visualised by clicking the associated Visualise button in the Heatmaps table.
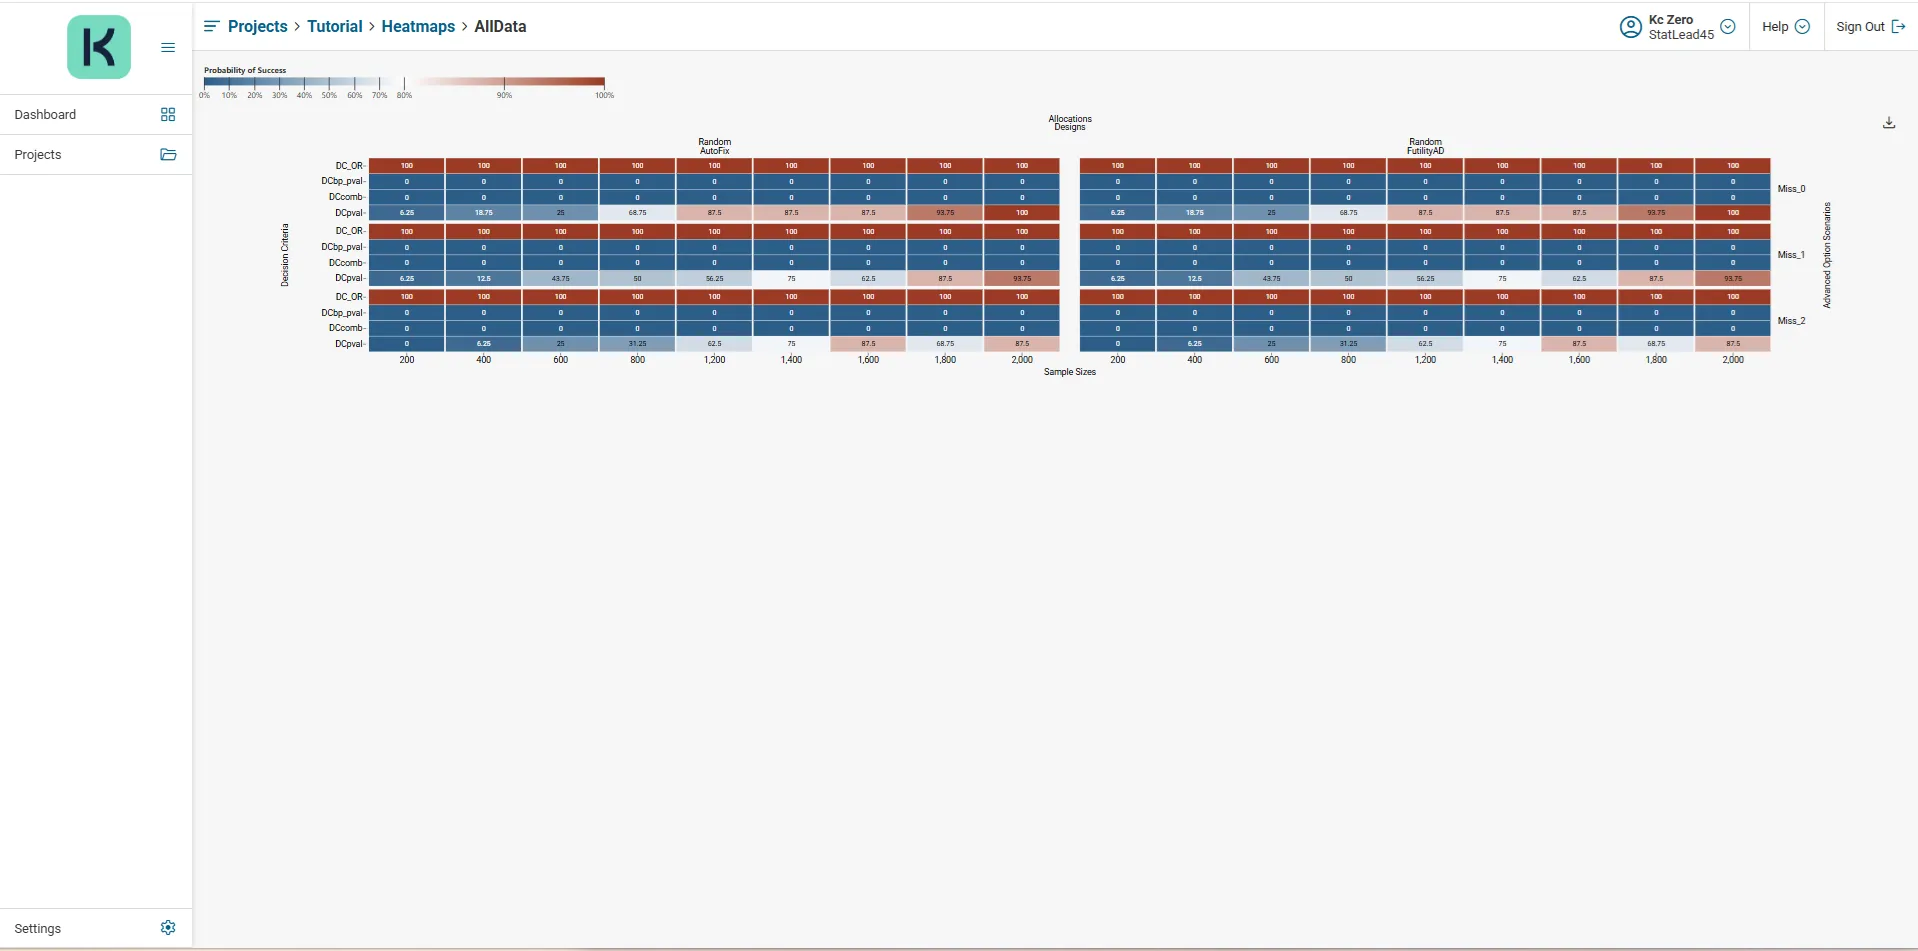
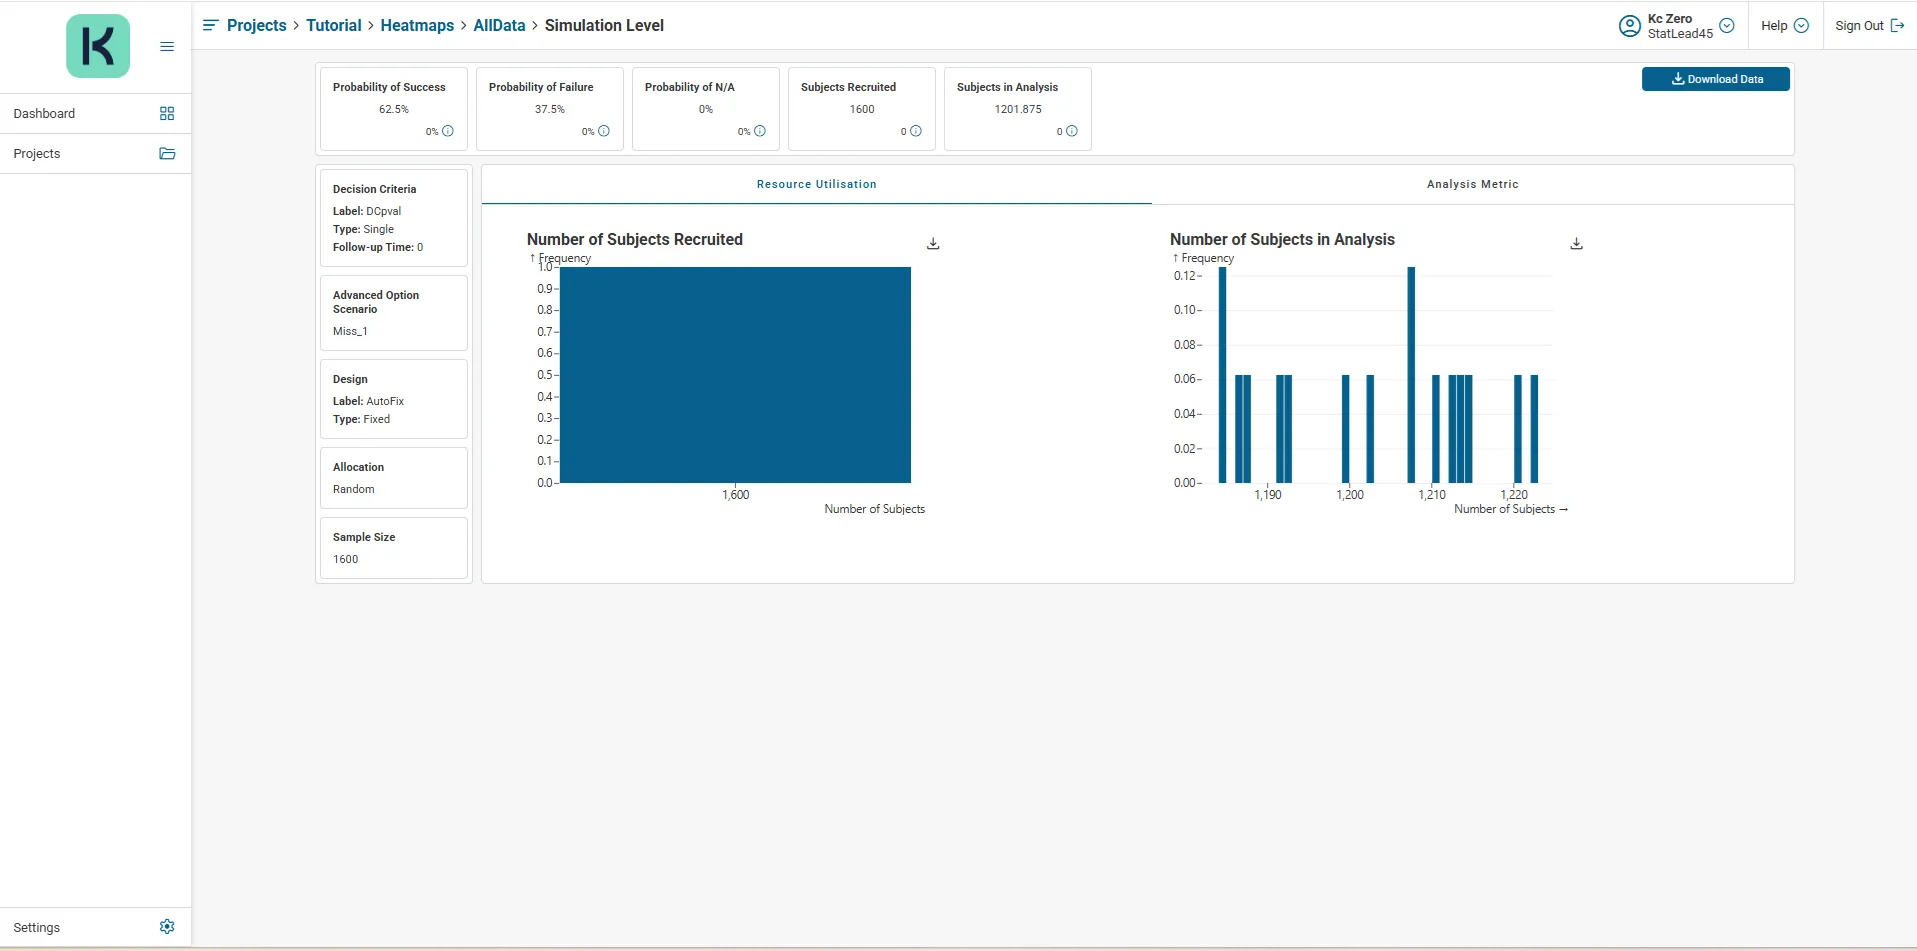
Clicking an individual cell in the heatmap will drill-through to detailed Simulation Level results for that specific intersection between row and column.
Congratulations
You have successfully set up a KerusCloud project, ran tasks for Virtual Population, Study Design & Analysis, Decision Criteria, created a heatmap and visualised study results.