

KerusCloud User Guide
Introducing KerusCloud
Section titled “Introducing KerusCloud”KerusCloud is a clinical trial simulation software that has been designed with a logical, linear workflow and modular design to optimise user experience, application performance and memory usage. There are three key functional tasks, shown in Figure 1 below:
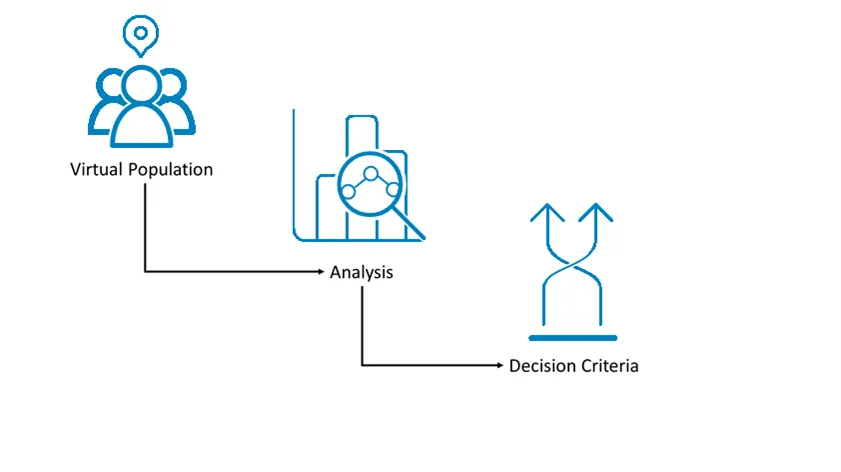 Figure 1: Work-flow schematic
- Virtual Population: Create a Virtual Population.
- Study Design and Analysis: Specify aspects of the study design including caps on recruitment from specific sites, adaptive designs and required analyses.
- Decision Criteria: Query analysis results based on specified Decision Criteria to produce a probability of success for each study.
At each stage, once the user clicks GO, a KerusCloud task is run on the cloud computing service. The system will then generate and save output files. Each task has a prerequisite of the successful completion of the previous stage. If an intermediate stage is changed (e.g. Study Design and Analysis) it is not necessary to re-run the tasks for the prior stages. However, tasks for subsequent stages will need to be re-run (by clicking the GO button again) to ensure KerusCloud uses the updated parameters and files.
KerusCloud facilitates three speed options when running the Virtual Population, Study Design and Analysis and Decision Criteria tasks. You can review the credit usage for each option and select the one that best balances speed and cost for your needs.
| Speed Option | Baseline Computation Power | Speed Gain | Example Task Time |
|---|---|---|---|
| Eco | 0.25 | 0.25 | 240 minutes |
| Normal | 1x | 1x | 60 minutes |
| Fast | 4x | 4x | 15 minutes |
- Baseline computation power is based on 16 cores on an AWS EC2 instance.
- Speed gain for each option can be up to a maximum of the stated factor.
Find Out More
Section titled “Find Out More”To find out more about each KerusCloud task, click into the relevent section below:
Virtual Population
The Virtual Population is created by identifying variables of interest, selecting a distribution for each variable, and then entering parameters to define the distribution. For example, a variable of normal distribution can be created by entering parameter values to represent the mean and standard deviation of the variable.
For each variable, KerusCloud will randomly (using the random number generator seed specified under simulation options) generate observations from the defined distributions to create a Virtual Population for each simulation.
Advanced options such as missingness, imputation and upper/lower truncations can also be specified for each variable, allowing a better representation of real world data.
Finally, estimands can be specified for each variable, based on estimand conditions. These specify how the simulated dataset should handle intercurrent events for example.
Variables can be generated with a range of parameter estimates corresponding to potential real world scenarios. For example, there may be uncertainty over the variability of a normally distributed variable and hence data may be simulated from a distribution with a low standard deviation as well as from one with a higher standard deviation. Scenarios can also be specified for features such as correlations, advanced options and estimands. These scenarios are labelled separately within KerusCloud so results from simulations based on each scenario can be queried independently.
Once the Virtual Population has been fully defined, pressing GO on the Virtual Population Review page results in the generation of a large dataset of simulated data.
Study Design & Analysis
Statistical analyses can be defined in Stage 2, based on variables defined and generated in Stage 1.
First, sample size(s) are defined, which must be less than or equal to the maximum cohort size defined under simulation options in Stage 1.
Finally, study design(s) indicate when the analyses will be performed (i.e. at the end for a fixed design vs at a specified interim for adaptive designs).
Once the sample sizes, analyses and study designs have been defined, pressing GO on the Analysis Review page runs the Study Design and Analysis task which sets up the specified study design(s) and analyses.
Decision Criteria
Decision Criteria are defined in Stage 3, resulting in a probability of success for each simulated study.
For example, the success or failure of a simulated trial may correspond to a significance threshold for the desired treatment effect. Using KerusCloud, this can be evaluated under a variety of sample sizes and real world scenarios; as each analysis used in a decision criteria is performed once for every simulation, covering all specified scenarios and sample sizes.
Multiple decision criteria can be defined based on the results of analyses defined during Stage 2. In addition, single decision criteria can be combined to evaluate a composite endpoint.
Once all the desired criteria have been defined, pressing GO on the Decision Criteria Review page results in the collation of results into probabilities of success for study outcomes.
The primary output of KerusCloud is a heatmap, which displays the probability of success for every combination of Scenarios, Study Designs (sample sizes, allocations, fixed and adaptive designs) and Decision Criteria in the project. The heatmap is colour-coded and can be filtered to allow identification of the optimal combination of design features.